What does the impedance signal of a single cell look like? What about a doublet?
The impedance signal of a single cell should appear as a single and isolated peak.

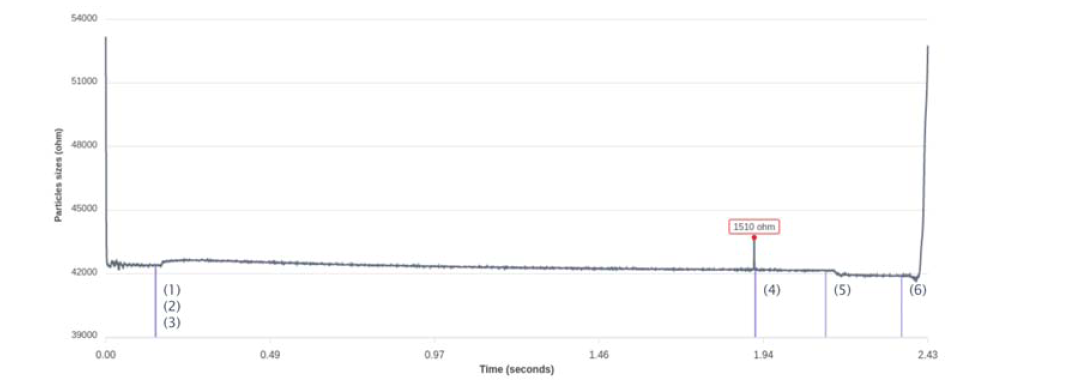
Figure | Example of impedance signal of a single cell (1510 ohm at ~1.90 seconds)
At the start, variations in the impedance signal are observed, primarily due to differences in conductivity between the buffer inside the LUTHOR scd Tip and the LUTHOR cell lysis buffer in the well (points 1, 2 and 3). When dispensing begins, the baseline remains continuous until a particle passes through the tip and is detected. This event is marked by a distinct and well-defined peak (point 4). After dispensing, fluctuations in the impedance signal can be seen as the tip exits the well (points 5 and 6).
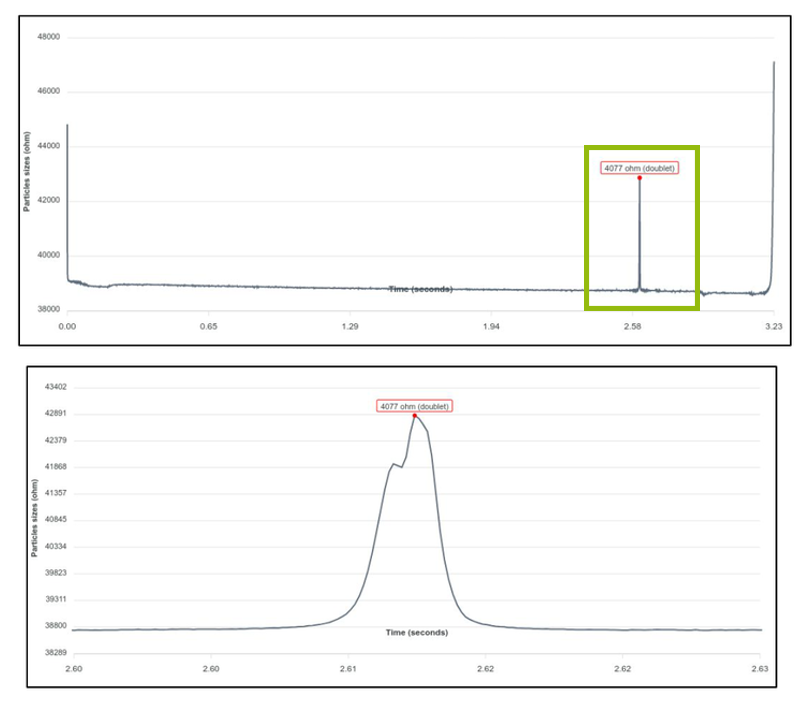
When a doublet is detected, the impedance signal displays two peaks which are close in proximity to one another. An example of a doublet can be found below:

Figure | Top panel displays the full impedance graph with doublet peak in a green box. The bottom panel provides a magnified view of doublet peak for better resolution.
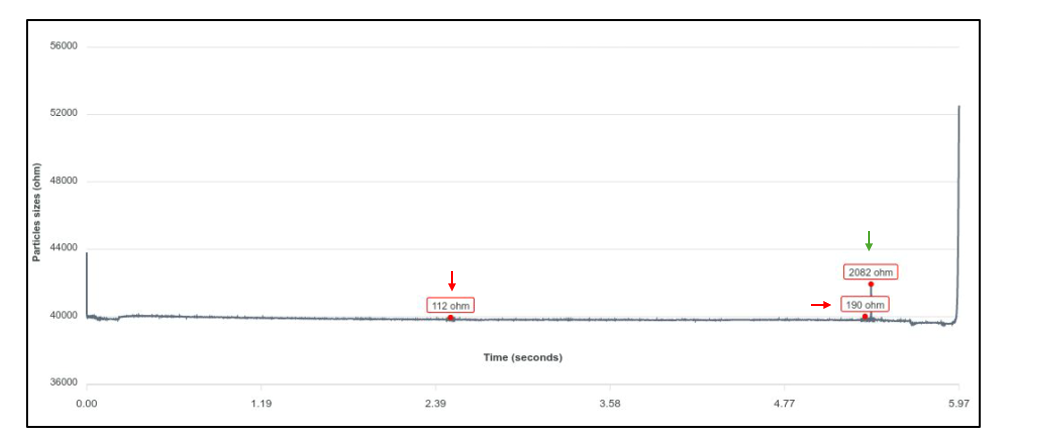
Particles/debris smaller than a cell can also be detected and would result in small ohm values (see Red arrows in Figure below):

Figure | Small particles or debris are noted by Red arrows at ~2.42 and ~5.30 seconds. A single cell (Green arrow) is detected at ~5.37 seconds.
